Current Research Projects
Oak Forest Exclosures
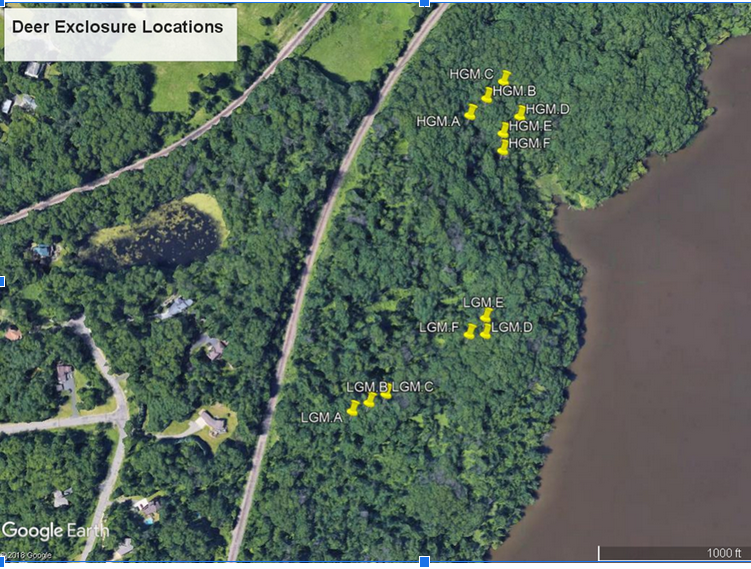
Where: In sets of paired plots spread throughout the oak dominated forest. The map below shows the locations of each plot pair, divided by relative garlic mustard abundance (HGM = high garlic mustard, LGM = low garlic mustard). Why: To test the hypothesis that white-tailed deer facilitate the invasion of garlic mustard by preferentially eating native plants and investigate the impact of white-tailed deer on the structure of the herb layer plant community at Ordway. What: Each set of paired plots contains one open 0.5m2 plot and one fenced-in 0.5m2 plot designed to exclude deer but not smaller herbivores (rabbits, etc.). The fenced-in plot includes a buffer region of 0.5m on each side, since deer can potentially eat parts of plants growing along the inside of the fence. Each year we collect estimated ground cover data on 23 key plant species, measure the tallest plants in each plot, and take note of deer herbivory.
RVS: Repeated Vegetation Survey
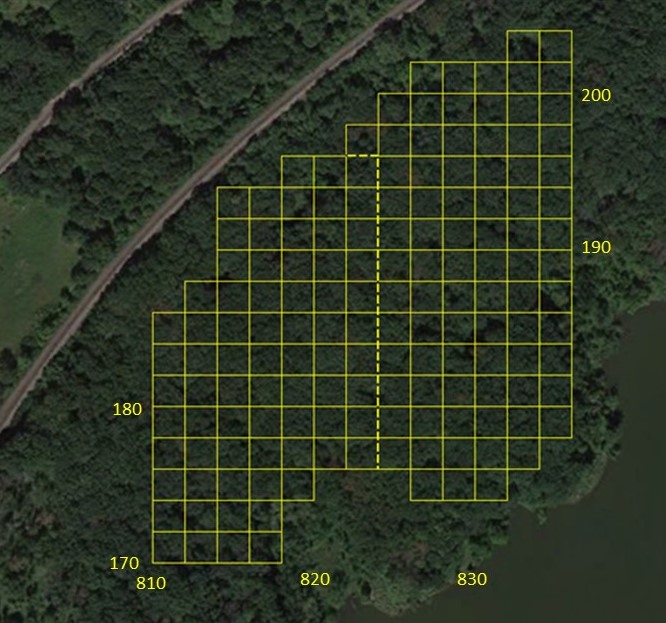
Where: In approximately 180 0.5m2 plots spread along a 20-by-20 meter grid in the oak dominated forest. The map below shows the RVS grid we use every year, though some points are now missing due to high water or downed trees. Why: To monitor changes in herb layer plants, including garlic mustard, over the long term. We pay special attention to:
- Environmental factors correlated with presence and cover (Do certain species prefer sunnier/dryer/steeper areas?)
- Inter-annual correlation, phenology, and spatial distribution (Does cover in one year predict cover in the next year?)
- Interactions with other herb species and white-tailed deer (Are certain species often seen together? What species are deer eating?)
What: We collect estimated groundcover data for 23 woody and herbaceous ground cover species, both native and introduced. We also measure the 5 tallest plants in each plot and take note of any deer herbivory.
EREN PFPP: Ecological Research as Education Network Permanent Forest Plot
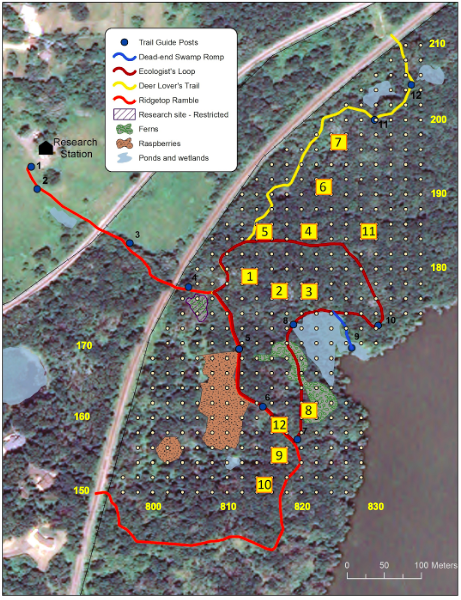
Where: In 12 20x20m plots spread throughout the oak dominated forest. Why: To track changes in forest composition and explore questions concerning tree biomass, woody plant biodiversity, and carbon sequestration. What: Student crews have collected data since 2013! Data collected include:
- Tree DBH (diameter at breast height, which is defined as 1.37 meters/ 4.5 feet above the ground)
- Tree health and damage (Is it alive? Dead? Is it snapped or missing lots of branches?)
- Dominant groundcover (e.g. forest floor, mosses, grass)
- Presence of non-native invasive species (buckthorn, honeysuckle, garlic mustard)
The map below shows the 12 plots we use, highlighted in yellow. Plot 7 is particularly fun due to the high density of young buckthorn and gooseberry (both are very pokey and like to introduce you to their thorns).
F2R2: Floodplain Forest Restoration Research
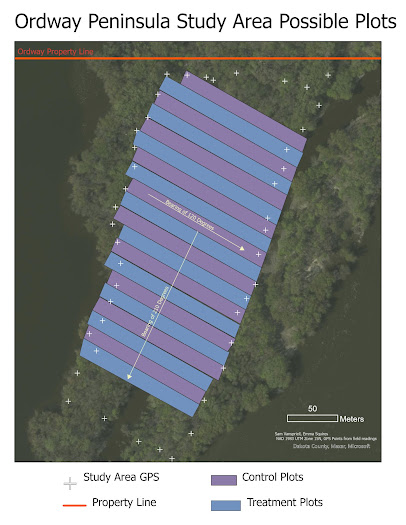
Where: The floodplain peninsula between River Lake and the Mississippi River, on the eastern side of the property. The map below shows the study area and the treatment bands. Why: To determine the effectiveness of invasive shrub (buckthorn and honeysuckle) removal and white-tailed deer exclosure with respect to restoring the floodplain forest ecosystem at Ordway.
What: The research area receives 2 sets of treatments:
- Removal of invasive shrubs (done on alternating bands in January of 2023) Deer exclosure (2-3 sets of open/exclosed plots in each band–similar setup to the oak forest deer exclosures)
We collect data about the tree canopy, the shrub layer, the herb layer (vegetation and seedlings), and earthworms!
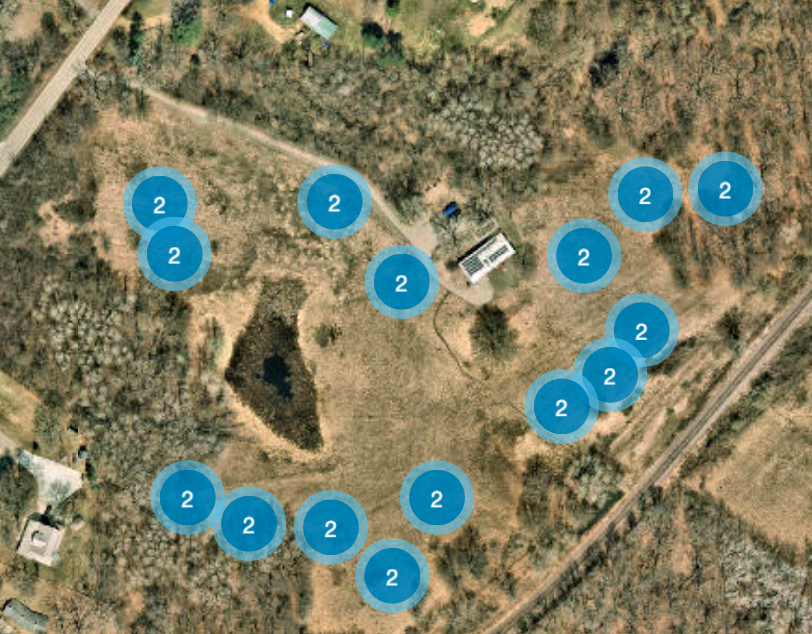
Project NestWatch
Where: 15 sets of paired nestboxes spread throughout the prairie. The map below shows where each pair is located–the white rectangle in the upper middle is the field station building, and Inver Grove Trail runs through the upper left corner. Why: To contribute data to Cornell University Lab of Ornithology’s Project NestWatch, a citizen science monitoring program that examines bird reproductive biology. What: We visit each nest box twice a week and collect data on nest status, egg and young presence, adult behavior, and other factors like pests. This means we sometimes get to see baby birds! We use a camera scope to limit our impact on the birds, and follow the protocols outlined by Project Nestwatch. If you’d like to learn more or participate in the project yourself, visit their website.


Comments
Post a Comment